

Bollinger Band Squeeze on EURUSD: 224 Real Breakouts Tested (2026)

Key takeaways
- I tested 224 Bollinger Band squeeze breakouts on EURUSD 5-minute data. Only 39.3% kept moving in the breakout direction two hours later.
- The average squeeze breakout lost 0.9 pips before spread. Traded blindly, the classic setup is a slow leak, not an edge.
- Session matters more than the signal: Asian-session breakouts continued just 37.8% of the time, while the London morning batch came out roughly break-even.
- A plain band touch reverted only 50.4% of the time, so the bands alone are a coin flip in both directions.
A Bollinger Band squeeze breakout on EURUSD 5-minute charts continued in the breakout direction only 39.3% of the time across 224 real signals I measured from June 3 to August 26, 2026, losing an average of 0.9 pips per trade before costs. The famous setup, on this pair and timeframe, does not pay for itself without a session filter.
How was the test run?

The test used 16,926 real EURUSD 5-minute bars covering June 3 to August 26, 2026. No demo account, no cherry picking, the same code ran over every bar. If you want to repeat it, the rules below are complete.
- Bands: standard Bollinger Bands, 20-period simple moving average, 2 standard deviations. The default every platform ships, including MT4 and MT5.
- Squeeze: bandwidth in the lowest 20% of the previous 300 bars. That is the textbook definition of volatility contraction.
- Signal: the first close outside either band while the squeeze was on.
- Measurement: where price stood exactly two hours later, in pips, in the direction of the breakout.
What did 224 squeeze breakouts actually do?
| Metric | Result |
|---|---|
| Breakouts measured | 224 |
| Continued after 2 hours | 88 (39.3%) |
| Failed or reversed | 136 (60.7%) |
| Average winning move | +7.3 pips |
| Average failed move | -6.2 pips |
| Net average per breakout | -0.9 pips |
Read that middle row again. Six squeezes out of ten broke out and then went nowhere or came back. The winners were slightly bigger than the losers, 7.3 pips against 6.2, but there were far fewer of them, and the net result is a small negative before you even pay the spread.
Does the trading session change the result?
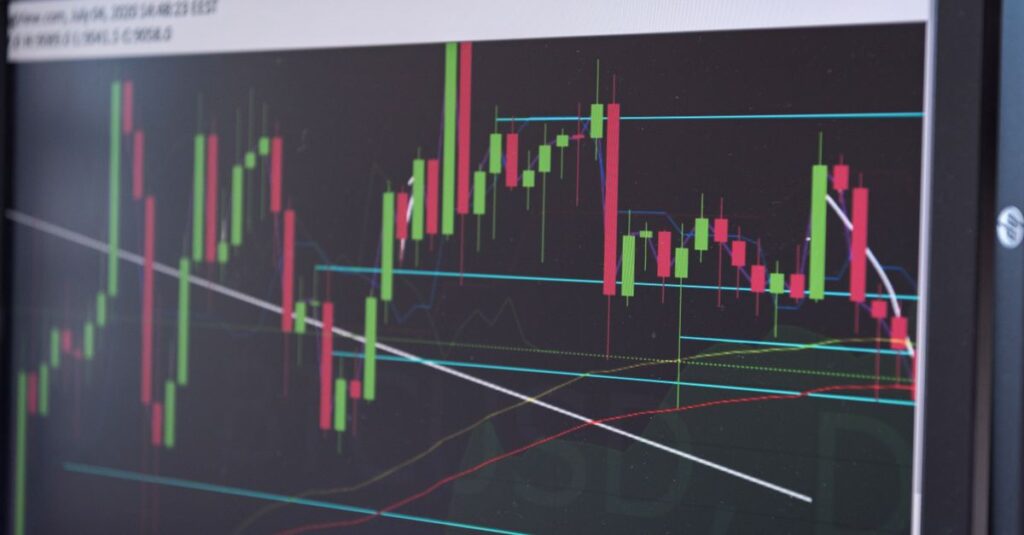
Yes, and more than any indicator setting does. I re-ran the same rules restricted by hour of day. The pattern matches what I found when testing the best hours to trade EURUSD.
| Session (UTC) | Breakouts | Continued | Net avg pips |
|---|---|---|---|
| All hours | 224 | 39.3% | -0.9 |
| Asia, 00:00 to 05:00 | 98 | 37.8% | -1.5 |
| London, 07:00 to 10:00 | 28 | 42.9% | +0.4 |
| New York, 12:00 to 15:00 | 11 | 54.5% | +4.3 |
Almost half of all squeezes fired during the Asian session, where EURUSD barely moves, and those were the worst performers. The New York morning batch looks much better, but be honest with the sample size: 11 trades is a hint, not proof. The safe conclusion is the negative one, that Asian-session squeezes on EURUSD are dead weight.
What about simple band touches?
Mean-reversion traders use the opposite logic: price closes outside a band, so bet on it snapping back. I measured 665 band touches on the same data. One hour later, price had moved back inside 50.4% of the time. That is a coin flip. The bands alone, in either direction, told you almost nothing on this pair and timeframe.
How should you actually use this?
Three practical rules fall out of the numbers. First, do not trade squeeze breakouts during the Asian session on EURUSD, that subset alone destroyed the whole average. Second, if you trade the squeeze at all, do it when real volume arrives, in the London or New York morning, and confirm with a trend filter such as the Supertrend or an ATR-based stop for the exit. Third, treat the bands as context, not as a signal, the same conclusion I reached testing RSI(7) against RSI(14) on 1,376 trades.
Frequently asked questions
Does the Bollinger squeeze work on higher timeframes?
This test covered 5-minute EURUSD only. Volatility contraction is real on every timeframe, but the payoff after the breakout has to be measured, not assumed. On M5 the payoff was negative. I will publish the H1 version of this test when the data set is large enough to be honest.
What Bollinger settings were used?
The platform defaults: 20-period SMA and 2 standard deviations. Changing settings does not change the conclusion much, because the problem is not the bands, it is the low follow-through of EURUSD after quiet periods. See the full settings guide for MT4 and MT5.
Is Keltner Channel squeeze better?
Slightly, in this data. The TTM-style squeeze, Bollinger Bands inside Keltner Channels, produced fewer signals with a 42.7% continuation rate, still under half. The full side-by-side is in Bollinger Bands vs Keltner Channels.
Why measure at two hours?
A 5-minute breakout trade either works within a couple of hours or it does not. Two hours is 24 bars, long enough for a real move, short enough that the result belongs to the breakout and not to the next session.
Want a clean indicator to install right now?
It is my own enhanced DeMARK Trend Line indicator for MetaTrader 4 and 5. Non repaint, clean, and free.

Forex educator and indicator developer. I build and trade my own MetaTrader tools, and share the ones that genuinely help.