

Linear Trend Indicator for MT4: Regression Lines for US Swing Traders (2026)

- A linear trend indicator fits a straight least squares regression line through the last N candles. The line marks the statistical middle of the current trend, not a smoothed average of it.
- The slope of that line is a direct read on trend direction and strength. Steep slope, strong trend. Flat slope, range.
- The regression channel adds deviation bands above and below the line. In a healthy trend, pullbacks to the lower band of a rising channel are the classic entry, with the midline as the first target.
- The whole line refits every time a new candle closes. That is the design, not a scam, but it makes the tool look smarter in hindsight than live. Judge it in real time.
A linear trend indicator is a statistical charting tool that fits a straight regression line through recent price, showing you the mathematical centre of the current trend instead of a smoothed average of it. Where a moving average trails behind price by design, a regression line cuts straight through the middle of the last N candles and tells you, in one glance, which way the market is leaning and how hard. Below: what the line and channel mean, how it differs from moving averages, the settings I run on MetaTrader, and where it will mislead you. Twenty three years of charts taught me that last part is the section most articles skip.
What Is a Linear Regression Line on a Forex Chart?
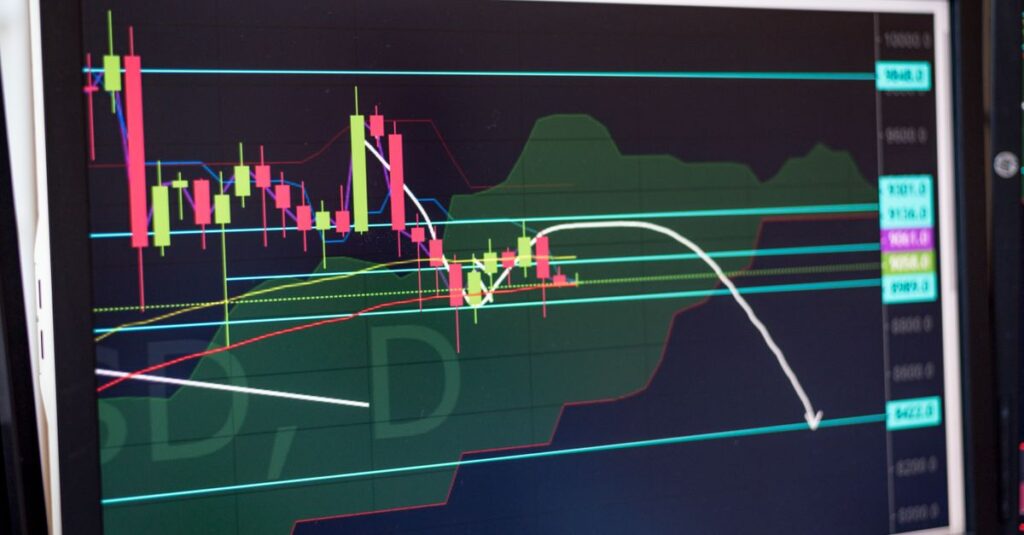
Take the last 100 closes on any Forex pair. Now draw the one straight line that sits as close as possible to all of them at once, measured by squaring the distance from each close to the line and minimising the total. That is linear regression, the classic least squares method applied to candles. Investopedia has the formal definition if you want the math, but the trading meaning is simple: the line is the market’s best fit path over the window you chose.
Two things make that line worth having on a chart. First, it is objective. Ten traders drawing trend lines by hand produce ten different lines. Ten traders running a 100 period regression get the identical line, every time. If you prefer rule based trend lines built from actual swing highs and lows, that is what I cover in my DeMARK indicator guide for MT4, and the two approaches complement each other: regression shows the statistical lean, DeMARK lines show the structural levels.
Second, the line has a slope, and the slope is a number, not a feeling. A moving average tells you direction only after you interpret its curve. A regression line hands you direction and steepness in the same object.
How Does the Linear Regression Channel Work?
The line on its own tells you lean. The channel tells you stretch. A linear regression channel takes the fitted line and adds two parallel lines above and below it. In the version most custom indicators use, the offset is one or two standard deviations of price around the line. In the drawing object built into MetaTrader, the outer lines sit at the maximum distance price reached from the midline during the window, which the MetaQuotes terminal documentation describes for MT5.
In theory, about 95 percent of closes should fall within two standard deviations of the midline. Price is not normally distributed, so treat that as a rough guide, not a law. Price at the lower band of a rising channel is cheap relative to its own trend. Price at the upper band is stretched. The channel turns “is this pullback deep enough” from a guess into a measurement.
One habit worth building early: watch the width, not just the bands. A narrowing channel means volatility is draining from the trend; one that suddenly widens after a news candle is telling you the old fit no longer describes the market.
Linear Regression vs Moving Averages: What Is the Real Difference?
Both tools summarise the same closes, so traders assume they are interchangeable. They are not, and the differences decide which jobs each one should do.
| Aspect | Linear regression | Moving average |
|---|---|---|
| How it is built | Fits one straight line that minimises squared distance to every close in the window | Averages the last N closes into a single point, repeated bar by bar |
| Lag | Endpoint hugs current price closely, minimal lag | Trails price by roughly half the period, by design |
| Trend strength | Slope is explicit and measurable | Needs a second tool like ADX to quantify |
| Stability | Entire line refits when a new bar closes | Past values never change |
| Best job | Framing the current trend and its normal stretch | Direction filter, dynamic support, crossovers |
The lag row deserves an honest footnote. There is a moving average built directly from this math, the least squares moving average, often labelled LSMA or linear regression curve. It plots the endpoint of a fresh regression on every bar, so it turns faster than an EMA of the same length and its past values stay fixed once printed. It sits alongside tools like the Supertrend indicator for MT4 in the fast trend filter category, and both appear in my roundup of the best MT4 Forex indicators.
The stability row is the one nobody mentions. A moving average you saw yesterday looks the same today. A regression channel you saw yesterday may have rotated, because today’s candles changed the fit. Neither is wrong, but you need to know which contract with the past you signed.
What Does the Slope Tell You About Trend Strength?
The slope is the quiet superpower of this tool. Direction is trivial, up or down, but steepness carries real information and most traders never use it.
A practical way to make slope comparable across pairs and timeframes is to normalise it by volatility: divide the price change the line covers over its window by the ATR of the same chart. A regression line climbing two full ATRs across its window is a trend with genuine pressure behind it. A line climbing a fifth of an ATR is drift wearing a trend costume, and drift is where band trades die.
Slope also gives you an early, if noisy, warning system. A strong uptrend whose slope flattens over ten or fifteen bars is decelerating, even while price still makes marginal new highs. That does not mean reverse your position. It means tighten risk and stop adding.
My rule of thumb: treat near zero slope as a no trade signal for this tool. A flat regression channel is a range, and ranges have their own playbook.
Which Settings Work in MT4 and MT5?

You can run linear regression two ways on MetaTrader. The built in route is a drawing object: Insert, then Channels, then Linear Regression, on both MT4 and MT5. Drag it across the bars you want and the terminal fits the channel. Free and instant, but static, so it will not refit as new candles arrive unless you redraw it. The second route is a custom indicator that recalculates the channel automatically on every bar, which is what I use. Installation is the standard two minute job I walk through in how to install an MT4 indicator, and MT5 users will find a wider pool of auto regression channels among my best MT5 Forex indicators.
Period choice is the setting that matters. Everything else is decoration.
| Use case | Chart | Regression period | Deviation | What it gives you |
|---|---|---|---|---|
| Big picture trend map | H4 or Daily | 200 to 300 | 2.0 | The regime you should be trading with |
| Standard swing channel | H1 | 100 | 2.0 | The workhorse: clear slope, meaningful bands |
| Faster intraday read | M15 | 50 | 1.5 to 2.0 | More signals, more noise, needs a filter |
Shorter periods hug price and refit after every swing. Longer periods give a stable frame that individual candles barely move. There is no correct number, only a correct question: which trend am I trying to trade? Pick the window that contains that trend and not much else.
How Do You Trade the Deviation Bands?

The channel gives you a complete pullback framework: a direction filter, an entry zone, and a target.
First, the filter. Only take longs when the channel slopes clearly up, only shorts when it slopes clearly down. This removes the most expensive band trading mistake: fading a trend. In an uptrend the lower band is an entry zone. The upper band is not a short signal, it is a take profit zone. Momentum markets will ride the upper band for days.
Second, the entry. Wait for price to reach the lower band of a rising channel, then wait again for a rejection: a candle that trades at or below the band but closes back inside the channel. The touch alone is not the signal. The recovery close is.
Third, the exit. The midline is the natural first target, because the tool’s premise is that price oscillates around its fitted centre. The upper band is the stretch target for the remainder. Stops go beyond the band by a volatility buffer, not at the band itself, since ordinary noise pierces the line regularly. This structure pairs naturally with a momentum confirmation, and I show working pairings in my Forex indicator combinations guide.
Alan’s Settings I Actually Run in 2026
People ask for exact numbers, so here are mine.
- Main channel: auto recalculating regression channel, 120 period, 2.0 standard deviations, on H1. I landed on 120 instead of the standard 100 because it spans roughly a week of H1 candles, which is the swing I actually trade.
- Context channel: 250 period, 2.0 deviations, on the Daily chart. If the H1 and Daily channels disagree on slope, I stand down. Some weeks that filter keeps me out of the market entirely. That is a feature.
- Slope filter: I only trade the H1 channel when its line covers at least one full ATR(14) across its window. Below that, I call it a range and leave the band playbook in the drawer.
- Entries: lower band touch in a rising channel, then a close back inside the channel before I act. Never on the touch itself.
- Risk: stop placed 1.5 times ATR(14) beyond the band that triggered the entry. First target the midline, where I take half off and move the stop to entry.
None of this is exotic. The value comes from the boring parts: the two timeframe agreement rule and the refusal to trade a flat slope. The indicator just makes those decisions visible enough that I cannot pretend I did not see them.
Where the Linear Trend Indicator Fails
This tool has three genuine failure modes, and if you trade it long enough you will meet all of them.
Regime change breaks it completely. A regression line is a straight line fitted to the past. When a central bank surprises the market, the trend the line describes stops existing in one candle. The channel cannot warn you. Worse, over the following bars it quietly rotates to fit the new data, and within a week the chart looks like the indicator saw it coming. It did not. Live, the decisive break of an established channel is your regime change alarm: it says the old playbook is void, not that a reversal trade is ready.
Hindsight on this tool flatters itself. Because the whole line refits on every bar, scrolling back through history shows you the final fit, not the fit you would have been looking at in the moment. Eyeballing old charts to validate a regression strategy is close to worthless. Test it forward on a demo, or with a tester that rebuilds the line bar by bar. This is different from a repainting arrow tool that silently deletes losing signals, which is straight deception, but the caution overlaps: verify in real time.
Flat markets turn it into noise. When the slope is near zero the midline means little and the bands become a crude range tool. A straight line is the wrong model for a sideways market, the same way it is the wrong model for a parabolic one. The fix is discipline, not settings: no slope, no trade.
Add one smaller irritation: window sensitivity. Change the period from 100 to 150 and the channel can tilt visibly. Pick your period for a reason, then leave it alone.
Frequently Asked Questions
Does the linear regression indicator repaint?
The channel refits every time a new candle closes, so past sections of the line do move. That is the mathematics of a best fit line, not a scam hiding losing signals. The practical consequence is real though: never judge this tool by scrolling through history, because you are seeing the final fit rather than what it showed live. If you want a regression flavoured line whose printed values never change, use the least squares moving average instead.
What is the best period setting for a linear regression channel?
There is no universal best, but 100 on H1 is a sensible starting point for swing trading, with 200 to 300 on H4 or Daily for the bigger regime and around 50 on M15 for intraday work. The honest rule is to match the window to the trend you intend to trade: the period should contain that swing and not much history beyond it.
Is a linear regression channel better than a moving average?
Neither is better, they do different jobs. The regression channel excels at framing the current trend, measuring its steepness, and defining how far a normal pullback should stretch. A moving average is a stable direction filter whose past values never shift, which makes it better for crossover logic and long term bias. I run both: the moving average decides whether I am allowed to trade, the channel decides where. What that permission slip is worth is measurable: of eight moving average crossover pairs tested on 16,926 EURUSD 5-minute bars, only the slow EMA 50/200 made money, so use a slow average as the gate and expect nothing from a fast one.
Is the linear trend indicator built into MT4 and MT5?
Yes, as a drawing object. On both platforms go to Insert, then Channels, then Linear Regression, and drag the tool across the bars you want fitted. The limitation is that the object is static, so it does not refit as new candles arrive. For a channel that recalculates automatically you need a custom indicator, installed like any other custom tool on MetaTrader.
Want a clean indicator to install right now?
It is my own enhanced DeMARK Trend Line indicator for MetaTrader 4 and 5. Non repaint, clean, and free.
{“@context”:”https://schema.org”,”@type”:”FAQPage”,”mainEntity”:[{“@type”:”Question”,”name”:”Does the linear regression indicator repaint?”,”acceptedAnswer”:{“@type”:”Answer”,”text”:”The channel refits every time a new candle closes, so past sections of the line do move. That is the mathematics of a best fit line, not a scam hiding losing signals. The practical consequence is real though: never judge this tool by scrolling through history, because you are seeing the final fit rather than what it showed live. If you want a regression flavoured line whose printed values never change, use the least squares moving average instead.”}},{“@type”:”Question”,”name”:”What is the best period setting for a linear regression channel?”,”acceptedAnswer”:{“@type”:”Answer”,”text”:”There is no universal best, but 100 on H1 is a sensible starting point for swing trading, with 200 to 300 on H4 or Daily for the bigger regime and around 50 on M15 for intraday work. The honest rule is to match the window to the trend you intend to trade: the period should contain that swing and not much history beyond it.”}},{“@type”:”Question”,”name”:”Is a linear regression channel better than a moving average?”,”acceptedAnswer”:{“@type”:”Answer”,”text”:”Neither is better, they do different jobs. The regression channel excels at framing the current trend, measuring its steepness, and defining how far a normal pullback should stretch. A moving average is a stable direction filter whose past values never shift, which makes it better for crossover logic and long term bias. I run both: the moving average decides whether I am allowed to trade, the channel decides where.”}},{“@type”:”Question”,”name”:”Is the linear trend indicator built into MT4 and MT5?”,”acceptedAnswer”:{“@type”:”Answer”,”text”:”Yes, as a drawing object. On both platforms go to Insert, then Channels, then Linear Regression, and drag the tool across the bars you want fitted. The limitation is that the object is static, so it does not refit as new candles arrive. For a channel that recalculates automatically you need a custom indicator, installed like any other custom tool on MetaTrader.”}}]}

Forex educator and indicator developer. I build and trade my own MetaTrader tools, and share the ones that genuinely help.
i always wondered why the channel looked so clean in hindsite, makes sense now
The part about the channel refitting after news finally explains why my backtest by eye never matched live trading. Thanks for being straight about it.
Question: does the LSMA you mention work on MT4 out of the box or do I need a custom file for that one?
Been drawing regression channels by hand for years and never thought about normalising the slope by ATR. Simple idea, immediately useful.